Introduction
Prizm Content Connect for SharePoint Integration uses the Unified Logging Service (ULS) to write information, warnings, and errors to the SharePoint Trace Logs.
Configuring the Logs
For the Prizm Content Connect for SharePoint Integration, the Event Level is set to Error and the Trace Level is set to Medium by default. You can modify the ULS logging settings by using Central Administration or by using PowerShell. Use the steps below to modify the settings using Central Administration:
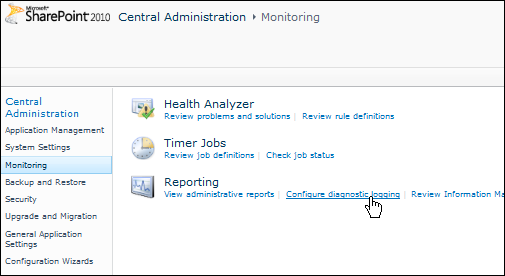
- Open Central Administration, browse to the Monitoring section and select Configure diagnostic logging under the Reporting section:
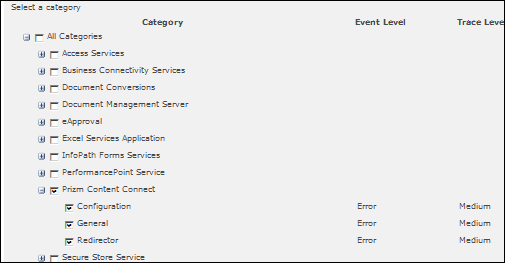
- The SharePoint Diagnostic Logging page displays. In the Event Throttling section, you can view the severity of events captured in the logs. You can select Prizm Content Connect or any of its components (Configuration, General, Redirector) to modify the settings for the components:
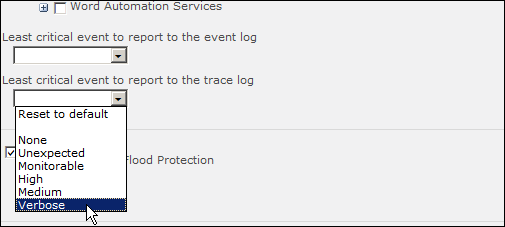
- You can use the drop-down boxes to select the least critical event to report. For example, you can select Verbose to log the most information:
- Click OK.
Analyzing the Logs
You can use the ULS Viewer provided by Microsoft to analyze ULS log files as described below. The ULS Viewer can be downloaded at archive.msdn.microsoft.com/ULSViewer. See ULS Viewer documentation for information on how to use it. To analyze the logs:
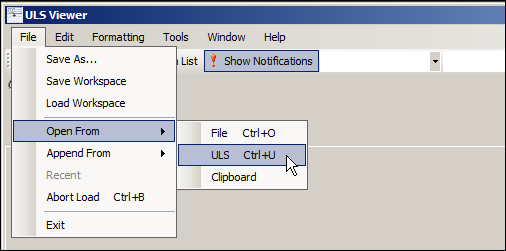
- Open the ULS Viewer application. Select File > Open From > ULS. A dialog displays for setting up the ULS runtime feed. Click OK to use the ULS feed from the default log-file directory:
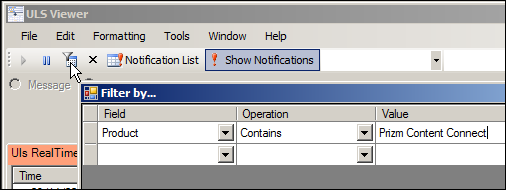
- If you would like to just view the logging for Prizm Content Connect, you can click Filter and specify that the Product Field contains the Value: Prizm Content Connect:
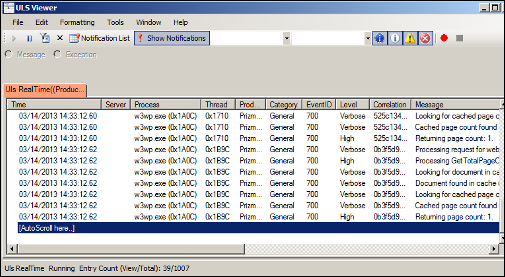
- As you use Prizm Content Connect for SharePoint, you will be able to see the logging for it in the ULS Viewer:


